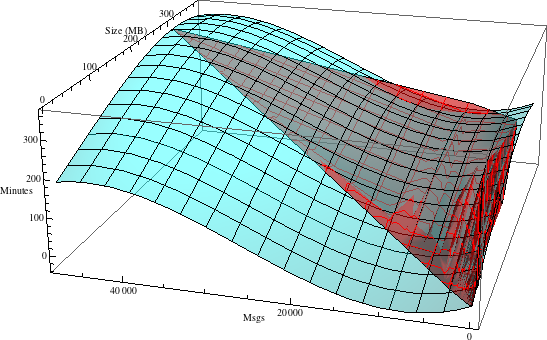

 And the big migration to Exchange starts. Of course pretty graphs are required in the analysis of how fast boxes migrate to estimate the load. What better way to do so than to send a Mathematica notebook to the migration team? Perhaps one which pulls data live from the server so they can get the stats themselves whenever desired (and rotate the graph too). Unfortunately I doubt many of you have Mma 6 (needed for transparency), and I'm not going to release the raw stats data either, so a picture will have to do.
The cyan plot is a quadratic fit, the red plot is a mesh of actual data points.
Copyright ©2000-2008 Jeremy Mooney (jeremy-at-qux-dot-net)